AWS Cost Explorer vs. Pricing Calculator
Compare AWS Cost Explorer’s historical cost analysis with Pricing Calculator’s workload estimates, and distinguish projections from verified savings.
· 10 min read

An AWS cost finding does not save money until someone changes the infrastructure. Teams often confuse identifying an opportunity with realizing a discount, so you need distinct tools to analyze past spend, project future costs, and measure the impact of an applied fix. Comparing AWS Cost Explorer vs Pricing Calculator clarifies how to answer the first two questions, while FinOps AI helps with the third: it applies approved fixes on AWS and tracks each one's estimated saving once the change has held.
Quick Answer: Match the Tool to the Question
AWS Cost Explorer analyzes historical reported AWS costs and usage, grouping past spend by service, account, or tag to project future spending based on those past patterns. Use it to find out what drove last month's bill or to monitor a live workload.
Conversely, the AWS Pricing Calculator estimates a workload from stated assumptions, modeling the cost of a proposed architecture or usage change before deployment. You can use it to compare pricing models, size a new environment, or calculate the financial impact of migrating to a different instance family.
FinOps AI sits directly in the remediation path because turning cost findings into approved, guarded AWS actions requires an execution and verification layer. An estimated reduction from a calculator represents an opportunity rather than a realized saving. FinOps AI executes the approved infrastructure change, checks the result, and records its estimated saving in a per-action ledger, complementing the native AWS planning tools.

AWS Cost Explorer: Diagnose Existing Spend
Opening AWS Cost Explorer displays reported cost and usage data grouped by predefined filters. You can use this interface to build baselines, detect anomalies, and track spending trends over time.
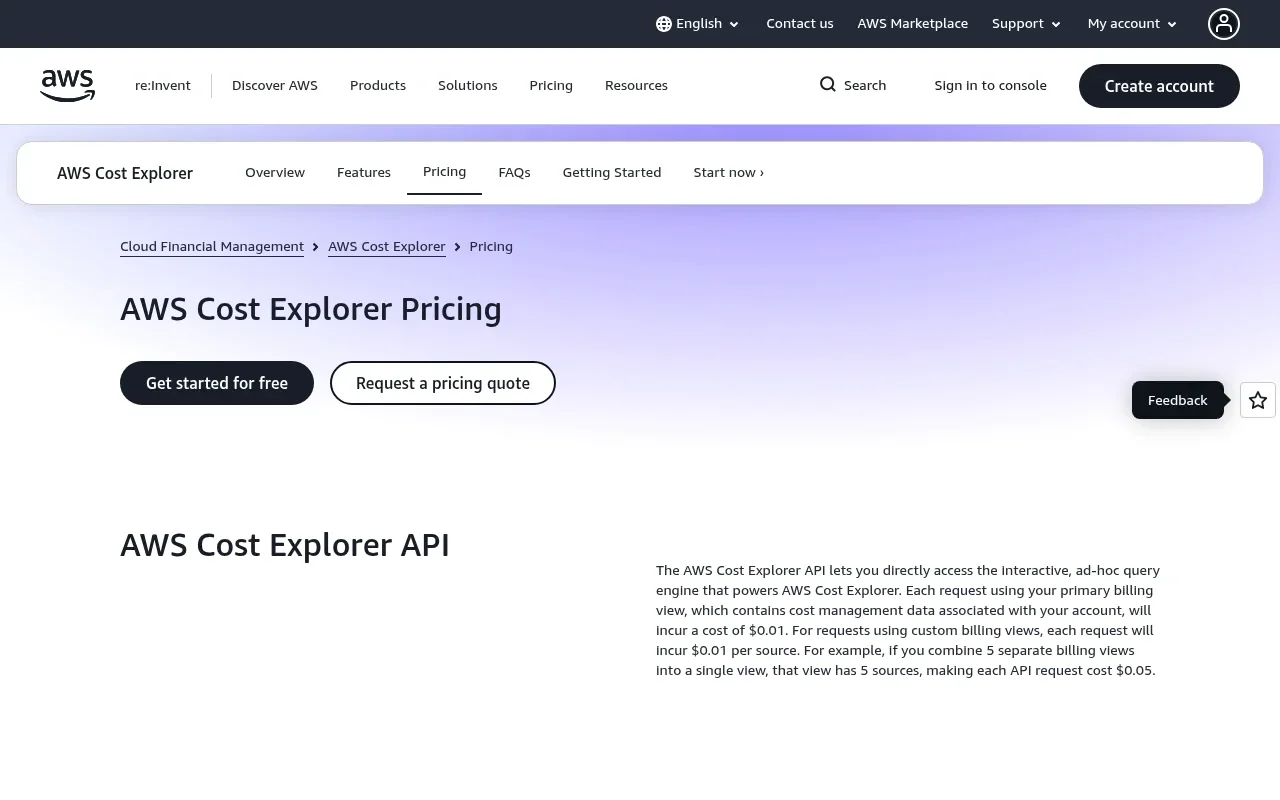
Historical costs, filters, and invoice caveats
The standard Cost Explorer view provides up to 13 months of historical data, and AWS refreshes cost data at least once every 24 hours, although some data can be updated later because refresh timing depends on upstream billing data. Cost Explorer reports let you analyze costs and usage using filters and groupings.
View this data as historical reported cost and usage rather than a final invoice. Current-month data appears in about 24 hours, though timing differences, rounding, cost presentation methods, amortization, and the application of credits or refunds prevent the chart from matching the amount due exactly. Taxes also apply differently to the finalized bill, so match accounts, dates, filters, and cost basis when comparing data across teams. Check the Bills page or the actual invoice for the finalized amount due.
Forecasts follow past usage
Cost Explorer forecasts project future spending based entirely on past usage. If your database footprint grew by 5% every month for the last year, the forecast extends that trend line forward.
AWS documentation says Cost Explorer forecasts have an 80% prediction interval, which gives a range for estimated costs. AWS notes that forecasts are estimates and can differ from actual charges. Because forecasts are based on past usage, Cost Explorer doesn't provide one when it lacks enough data to calculate that interval. AWS says this is common for accounts with less than one full billing cycle.
Because a forecast projects an existing pattern, it cannot model a proposed architecture change, predict the impact of a newly purchased Savings Plan, or account for a planned migration.
Resource-level data has limits
Engineers investigating a specific resource may expect Cost Explorer to function like a permanent ledger of every instance's lifetime cost. By default, however, the tool aggregates data at the service level. Opt-in daily resource-level data covers selected services for the previous 14 days, helping you pinpoint which EC2 instance or RDS database drove a recent spike. Outside that 14-day window, or for unsupported services, costs aggregate by usage type and often lack a specific resource ID.
AWS Pricing Calculator: Model Future Workloads
To determine the financial impact of a decision before deployment, model the scenario. The AWS Pricing Calculator uses your service and usage assumptions to estimate a monthly cost.
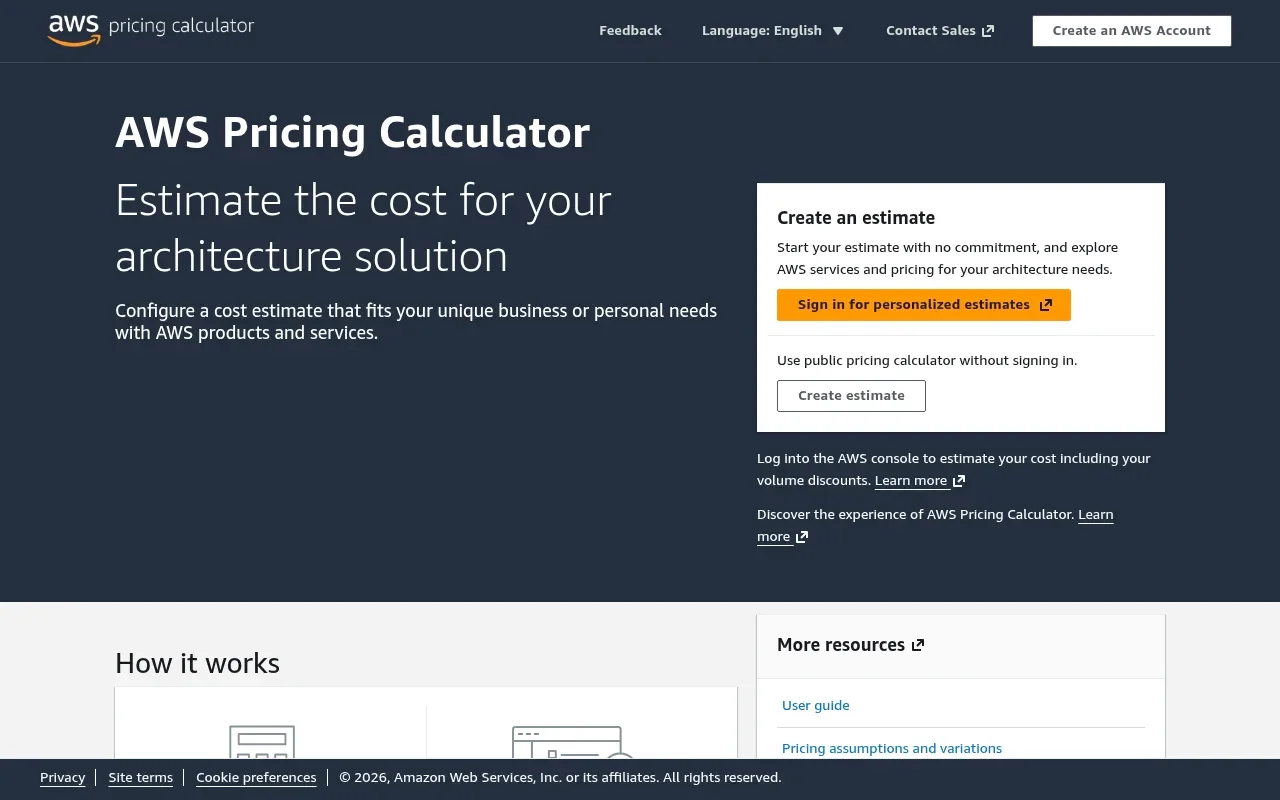
Public and in-console calculator experiences
The calculator exists in two forms. The public calculator requires no AWS account and uses AWS's published rates, including On-Demand and published Savings Plans and Reserved Instance pricing, but none of your account's own discounts, letting you estimate a net-new architecture without logging in or risking accidental changes to existing billing configurations.
The in-console calculator requires an AWS account and can use existing usage, discounts, and purchase commitments to build estimates. It offers workload estimates for modeled architectures, while bill estimates automatically include last month's consolidated billing usage and existing commitments and are available only to management or standalone accounts.
Inputs, rates, and estimate limits
Building an accurate estimate depends on precise inputs. For an EC2 deployment, selecting the instance type is only the first step before configuring payment options like On-Demand pricing, a Compute Savings Plan, or a Reserved Instance. From there, you define the EBS storage type, provisioned IOPS, detailed monitoring preferences, and expected outbound data transfer volumes. A small miscalculation in outbound traffic assumptions routinely doubles the estimated cost of a bandwidth-heavy application.
Estimates exclude applicable taxes, and actual fees depend entirely on deployed usage. Because the calculator assumes your application runs exactly as modeled, estimating a workload at twelve hours a day while leaving the instances running constantly results in a bill reflecting the actual uptime.
Compare Them on the Same Criteria
Evaluating a proposed optimization requires understanding what each tool provides and where its visibility stops.
| Criterion | AWS Cost Explorer | AWS Pricing Calculator |
|---|---|---|
| Question answered | What did AWS cost, how is usage changing, and what might spend look like if past patterns continue? | What might a planned AWS workload, architecture, or usage scenario cost? |
| Data source | AWS cost and usage data, grouped by tags, accounts, and services. | Entered service specifications and usage assumptions. |
| Useful scope | Investigating current or historical spend, preparing a baseline, and monitoring live workloads. | Planning a new workload, comparing architecture options, or modeling a commitment change. |
| Output format | Interactive charts, aggregated cost tables, and CSV exports of historical or forecasted spend. | Line-item estimates, shared calculation links, and exported PDF/CSV summary reports. |
| Primary limitation | Forecasts project past trends and cannot model proposed architecture changes. | Estimates do not report deployed usage or prove that a planned saving occurred. |
Compare the source of each figure
Cost Explorer works exclusively from reported AWS cost and usage data. When you query the cost of an S3 bucket over the last three months, the tool reads the existing billing records AWS generated for that bucket.
The Pricing Calculator works from entered workload and pricing assumptions instead. For a similar S3 bucket, the calculator applies public or imported rates to the storage volume, API requests, and data transfer volumes you manually specify.
Compare the question and best-fit use
Use Cost Explorer when investigating past events. If someone asks why the development account exceeded its budget last week, Cost Explorer provides the filters needed to isolate the specific tag or service responsible for the overrun.
Choose the Pricing Calculator to test a hypothesis. If you plan to migrate a fleet of instances to Graviton processors, the calculator models the exact hardware specifications, expected utilization, and relevant pricing plans to produce a comparison.
Compare what each tool cannot establish
Cost Explorer cannot verify the effect of a specific remediation immediately after the change because amortization, delayed billing data, and overlapping workloads obscure the impact of modifying a single instance.
Similarly, a calculator estimate never reports deployed usage. Modeling a highly optimized environment does not lower the AWS bill on its own, and neither tool proves that a specific engineering action produced the exact savings modeled in the planning phase.
Keep Forecasts, Estimates, and Savings Separate
Financial terminology blurs quickly during a cloud migration or an optimization sprint. A team might present a calculator output to finance and call it a saving, causing friction a month later when the bill remains unchanged.

Give each number a distinct label
Assigning specific labels to financial figures prevents miscommunication between engineering and finance teams:
- Historical reported cost: Cost Explorer data for a defined period, scope, and cost basis.
- Cost Explorer forecast: A projection based entirely on past usage patterns.
- Pricing Calculator estimate: A scenario result based on stated workload, usage, pricing, and commitment assumptions.
- Potential savings: An estimated opportunity or modeled difference between current spend and a proposed configuration.
- Verified savings: Measured impact after an action, compared with a consistent baseline and estimate.
This labeling practice aligns with the FinOps Foundation's recommendation to measure actual impact against estimates by tracking opportunities through resolution.
EC2 example: model first, verify later
Consider an application running on oversized EC2 instances. Use Cost Explorer to inspect existing cost and usage patterns and establish the historical cost baseline. Separate utilization data shows CPU utilization never exceeds 10%.
Next, opening the Pricing Calculator allows you to model a planned configuration using smaller instance types. Entering the new hardware specifications and comparing the output to your baseline yields your potential savings, representing an estimated monthly impact before any change occurs.
After securing approval and executing the instance resize, compare the observed post-change results against the original baseline using a consistent cost metric. Record the difference as verified savings only when the billing evidence supports it. If a critical application fails on the smaller instance and forces a rollback, log zero verified savings. The estimate was accurate for the modeled scenario, yet the action failed verification.
FinOps AI: Turn Findings Into Approved AWS Action
Many cost tools stop at visibility. They point to an oversized instance, offer a potential savings figure, and leave the engineering team to manage the ticket, secure approval, schedule the change, execute the script, and verify the result manually.
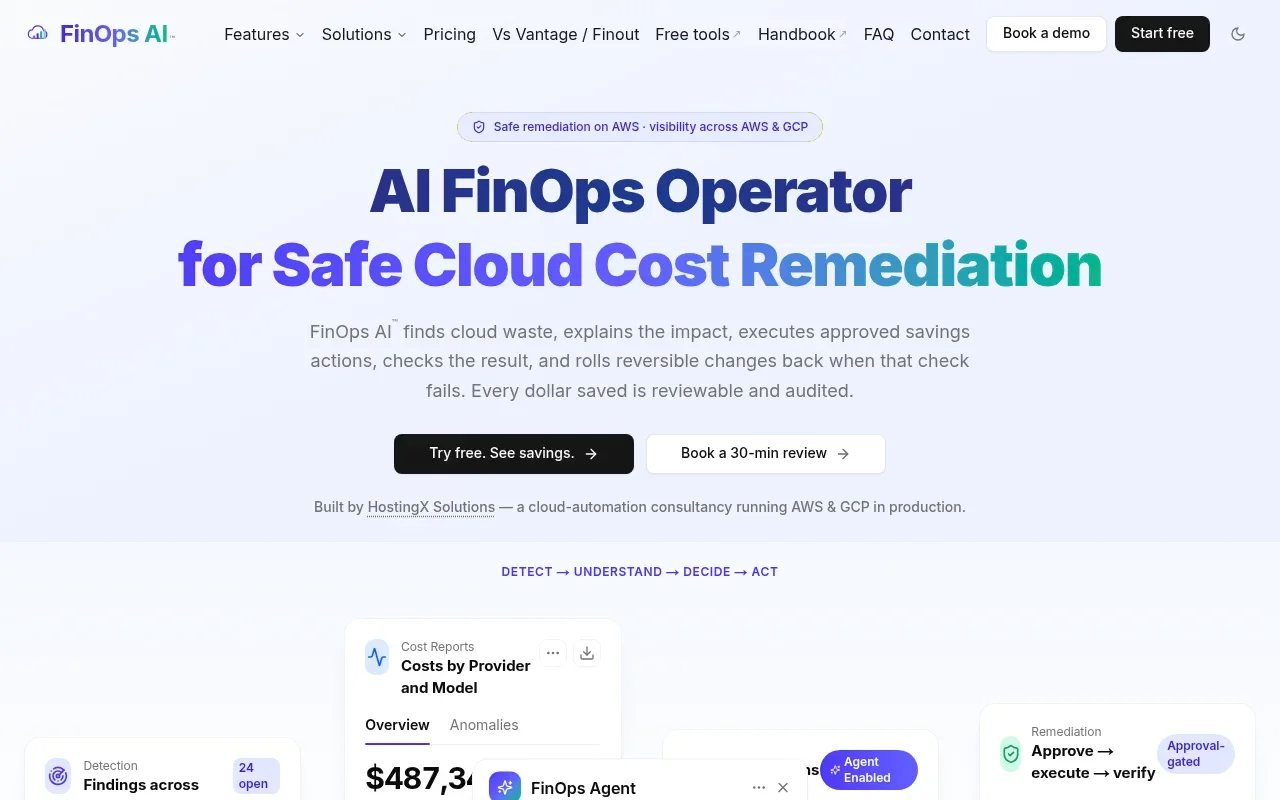
FinOps AI treats cost optimization as an operational workflow rather than a reporting exercise, bridging the gap between calculating a potential saving and acting on it.
Surface the finding and require approval
The platform identifies waste across your environment, flagging idle resources, unattached storage volumes, and oversized instances. For the fixes it can carry out on AWS, such as stopping an idle instance or deleting an unattached volume, FinOps AI runs an approval-gated change instead of leaving the finding on a dashboard. A resize stays a recommendation for your team to make.
Stopping an idle EC2 instance or deleting an unattached EBS volume goes through an approval request that an owner or admin decides, in the app or in Slack. Platform engineering, SRE, and DevOps teams retain control because every change waits for that approval, unless an admin has set that action type to run automatically in that account (reversible actions only), and guardrails apply to every change.
Verify safely or roll back
Executing the change is only the midpoint of the workflow, and FinOps AI then checks the result: when it stops an instance or a database, it checks the state AWS reports back, and for other actions it checks that AWS accepted the change.
If that check fails, the platform flags the discrepancy, and reversible changes roll back automatically, restoring the original configuration. The check looks at what the cloud API returned, not at your application's health, so watching the application stays with your team. Irreversible changes, such as deletions, cannot be rolled back.
When a stop or deletion succeeds, FinOps AI books its estimated monthly saving as pending in its savings ledger, looks the resource up again about seven days later, and counts the saving only if the change has held. These are estimates, not the verified savings defined above: they are not reconciled with your AWS invoice or Cost Explorer and do not reflect your discounts. Every action is recorded in a tamper-evident audit trail.
Add wider cost context without blurring scope
While the remediation loop focuses on AWS, modern infrastructure rarely stays within one provider's boundaries. FinOps AI provides a shared AWS and Google Cloud cost view to help teams monitor their entire footprint from one workspace. You can compare spend across cloud accounts across different environments without managing separate billing pipelines, and this visibility extends to specialized workloads like Bedrock and Vertex AI spend, SaaS subscriptions, and Kubernetes workloads.
The operational boundary is clear: FinOps AI executes and rolls back approved changes in AWS, while the Google Cloud integration focuses on cost and usage visibility. The multi-cloud and AI cost views support the planning phase, while the approval-first execution engine applies only to AWS resources.

Verdict: Use Both for Different Questions
Choosing between Cost Explorer and the Pricing Calculator means defining the problem you need to solve. Neither tool replaces the other, and ignoring either leaves a gap in the planning process.
Start with the question at hand
Use Cost Explorer when investigating existing spend, explaining a cost spike, establishing a baseline, or projecting next month's bill based on current trends. If the resource already exists and generates billing records, start the investigation there.
Switch to the Pricing Calculator when planning a new workload, comparing architecture alternatives, or modeling a usage scenario. If the resource does not exist yet, or if the configuration requires a significant update, start the planning phase there.
Pair the tools when evaluating an optimization
When proposing a cost-saving change, pair the tools by finding the current cost of an idle database in Cost Explorer and modeling the cost of a smaller instance in the Pricing Calculator. Subtracting the estimate from the baseline calculates the potential saving.
Neither tool verifies that the optimization saved money after deployment. That takes a separate step: guarding the change, watching the application afterwards, and comparing the bill against the baseline.
Answer common follow-up questions
- Is Cost Explorer a pricing calculator? It functions strictly as an aggregator of historical spend and a forecaster of past patterns, lacking the ability to model new architectures.
- Does the calculator include existing discounts? The public calculator uses AWS's published rates but none of your own discounts, while the in-console calculator imports usage and models supported discounts and commitments based on the estimate type and account settings.
- Do these tools prove savings? They provide historical analysis and future estimates, whereas proving savings requires measuring post-action impact against a baseline.
- Does FinOps AI remediate Google Cloud resources? The platform provides cost and usage visibility for Google Cloud, while reserving its approval-first remediation engine for AWS.
A modeled reduction remains a theory until the infrastructure changes. A resize or a commitment stays with your team and your usual change process; for waste FinOps AI can act on, such as idle instances and unattached volumes, connect your environment to turn findings into approved, guarded AWS changes.
Stop tracking estimates in spreadsheets. Try FinOps AI to surface cost findings, approve infrastructure changes safely, and automatically roll back reversible actions if verification fails.
Sources
- up to 13 months of historical data · docs.aws.amazon.com
- 80% prediction interval · docs.aws.amazon.com
- in-console calculator · docs.aws.amazon.com
- tracking opportunities through resolution · finops.org